A slow Blender render almost never has a single cause. The same 30-second-per-frame scene can be slow because of sampling, because of light bounces, because the BVH is rebuilt every frame, or because your GPU quietly fell back to CPU rendering an hour ago. Most "speed up Cycles" articles hand you the same five tips and hope one of them sticks.
This guide does the opposite. First we diagnose where your time is actually going, then we fix it; with four advanced Cycles settings that experienced artists routinely miss, a list of quick wins for any scene, and a decoder for the crash codes that stop a render dead.
This is built on render data, not guesswork. Drop & Render has run a Blender render farm for over a decade, processing millions of frames across every Blender version from 2.78 to 5.x. The bottlenecks below are the ones we see jam up real production jobs; see our hardware numbers at our benchmarks.
Quick answer: why is my Blender render slow?
If you only read one paragraph: a Blender render is slow because of one of four things; too many samples, too many light bounces, geometry/BVH being re-synced every frame, or your render silently falling back to the CPU. Open the render window, read the status line, and find out which before you change a single setting. Cutting your noise threshold and bounce counts will typically reclaim 20–40% with no visible quality loss; moving the heavy lifting to a render farm reclaims the rest.
Step 1: Diagnose the bottleneck before you touch a setting
Blender tells you exactly where your time goes; most people just never read it. Before changing anything, do three things:
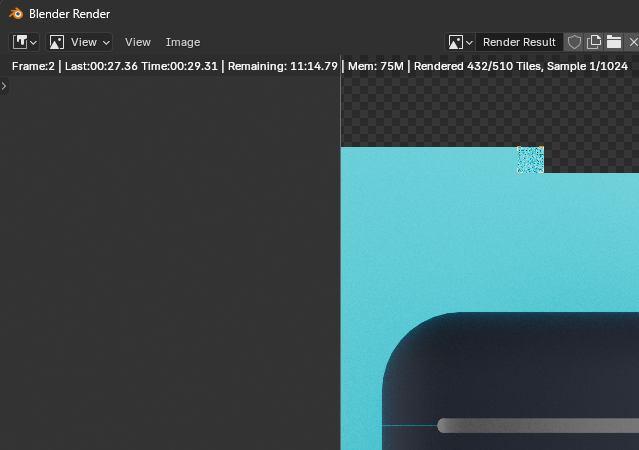
Read the render status line. During a render, the header of the render window shows the current phase: Synchronizing, Updating Geometry, Building BVH, Path Tracing, then Denoising. Watch which phase eats the clock. A render that spends 40 seconds "Building BVH" and 8 seconds path tracing has a completely different problem than one that path traces for two minutes.
Turn on the render time stats. Enable the metadata stamp (Output Properties -> Metadata -> Render Time, or use the system console) so every frame logs its real duration. Then break a single frame into its parts: sync time, BVH build, sample time, and denoise time. The biggest number is your target. Everything else is a distraction.
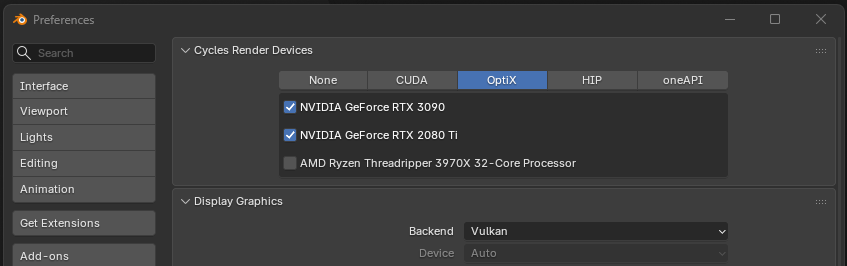
Confirm you are actually rendering on the GPU. This is the single most common "why is it so slow" cause we see in support. Check Edit -> Preferences -> System -> Cycles Render Devices and make sure your GPU is ticked. Then check Render Properties -> Device is set to GPU Compute, not CPU. A scene that exceeds VRAM, or a driver hiccup, can silently push you back to CPU mid-session; and CPU rendering is often 5–15× slower.
Once you know which phase is the bottleneck, the four settings below map directly onto it: sampling and bounces fix path tracing time, Persistent Data fixes sync/BVH time on animations, and scrambling distance squeezes the GPU sampling itself.
The 4 advanced Cycles settings that actually move the needle
These are not "enable GPU rendering" and "use the denoiser"; you already know those. These are the levers experienced artists under-use, with the specific values and the trade-offs that the tooltips don't tell you.
1. Stop raising Max Samples. Tune the Noise Threshold and Min Samples instead.
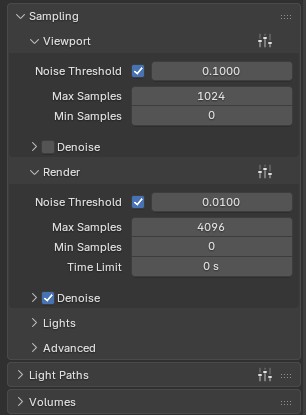
Most artists control quality with Max Samples; and that is the wrong dial. With Adaptive Sampling on (Render Properties -> Sampling), Cycles stops sampling a pixel the moment it's clean enough. The setting that decides "clean enough" is the Noise Threshold, not Max Samples.
- Noise Threshold (default
0.01): this is your real quality knob. Raising it to0.02finishes far faster and is often visually identical on textured, well-lit scenes. Dropping it to0.005is for hero stills only. - Max Samples: treat this as a safety ceiling, not a target. Set it high (e.g. 2048–4096) so it almost never triggers; the noise threshold should be what ends the render.
- Min Samples: the under-used one. Setting this to roughly 10–20% of Max Samples prevents Cycles from terminating dark or high-contrast pixels too early; which is what causes blotchy patches and fireflies that no amount of denoising fully fixes.
Pair this with the right denoiser: OptiX for blazing-fast GPU denoising (great for animation and previews), OpenImageDenoise (OIDN) when you need maximum detail retention on a final still.
2. Turn on Persistent Data for animations (and know the VRAM cost)
For animations, Cycles re-synchronizes your scene, re-uploads geometry, and rebuilds the BVH for every single frame by default. If your "Building BVH / Synchronizing" phase is long, this is the fix.
Enable Render Properties -> Performance -> Final Render -> Persistent Data. Blender keeps the scene data resident between frames and only updates what actually changed, which can shave seconds, sometimes many seconds, off every frame in a static-camera or low-change animation. Over 300 frames, that adds up fast.
The trade-off you must know: Persistent Data keeps everything in memory, so it increases RAM and VRAM usage. On a tight-VRAM card it can be the difference between rendering and an out-of-memory crash (see the crash section below). On an animation where geometry changes wildly every frame, the savings shrink. Use it on motion-graphics, product-turntables, and camera-move shots; test it carefully on heavy simulations.
3. Enable Automatic Scrambling Distance (GPU only)
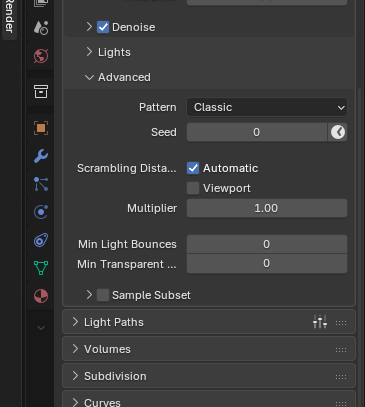
This is a genuinely advanced, GPU-only convergence trick that most tutorials skip. In Render Properties -> Sampling -> Advanced, enable Scrambling Distance -> Automatic. It adapts the randomness pattern Cycles uses based on your sample count, which can measurably speed up GPU rendering; and it tends to help most on animations.
The catch, and why it's off by default: it can introduce subtle artifacts or flicker on fire, smoke, volumetrics, and particle simulations. So enable it, render a short test range, and actually look at the frames before committing a full job. On clean geometry and product work it's close to free performance.
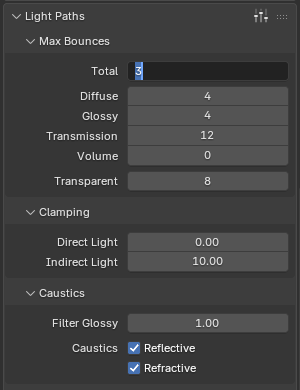
4. Cut your light bounces and clamp the indirect light
Cycles ships with 12 total bounces; far more than most scenes need. After about 4–6 bounces, the remaining light energy is too small to change the image, but you still pay full price for it. In Render Properties -> Light Paths -> Max Bounces, drop Total to 4–8, Diffuse to 2–3, Glossy to 2–3, and Transmission to 4 for typical scenes. This alone commonly trims 20–30% off path-tracing time with no visible difference.
Two companions in the same panel:
- Clamping -> Indirect Light ≈ 10. This kills fireflies at the source instead of forcing you to throw more samples (and time) at them. Lower it further if fireflies persist; add a small Direct Light clamp only if needed, since clamping direct light can flatten highlights.
- Light Tree (Sampling -> Lights): keep it on for scenes with many lights; it samples them far more efficiently. For a simple single-HDRI or one-key-light scene, the per-sample overhead can outweigh the benefit, so test toggling it off.
One honest caveat for farm and GPU users: Path Guiding (also under Sampling) is excellent for tough interior lighting through small windows; but it is CPU-only. If you render on GPU (as most farm users do), it won't apply. Lean on bounces, clamping, and the Light Tree instead.
Quick wins: simple improvements that help any scene
No deep tuning required; these reliably help almost any project, and most take seconds:
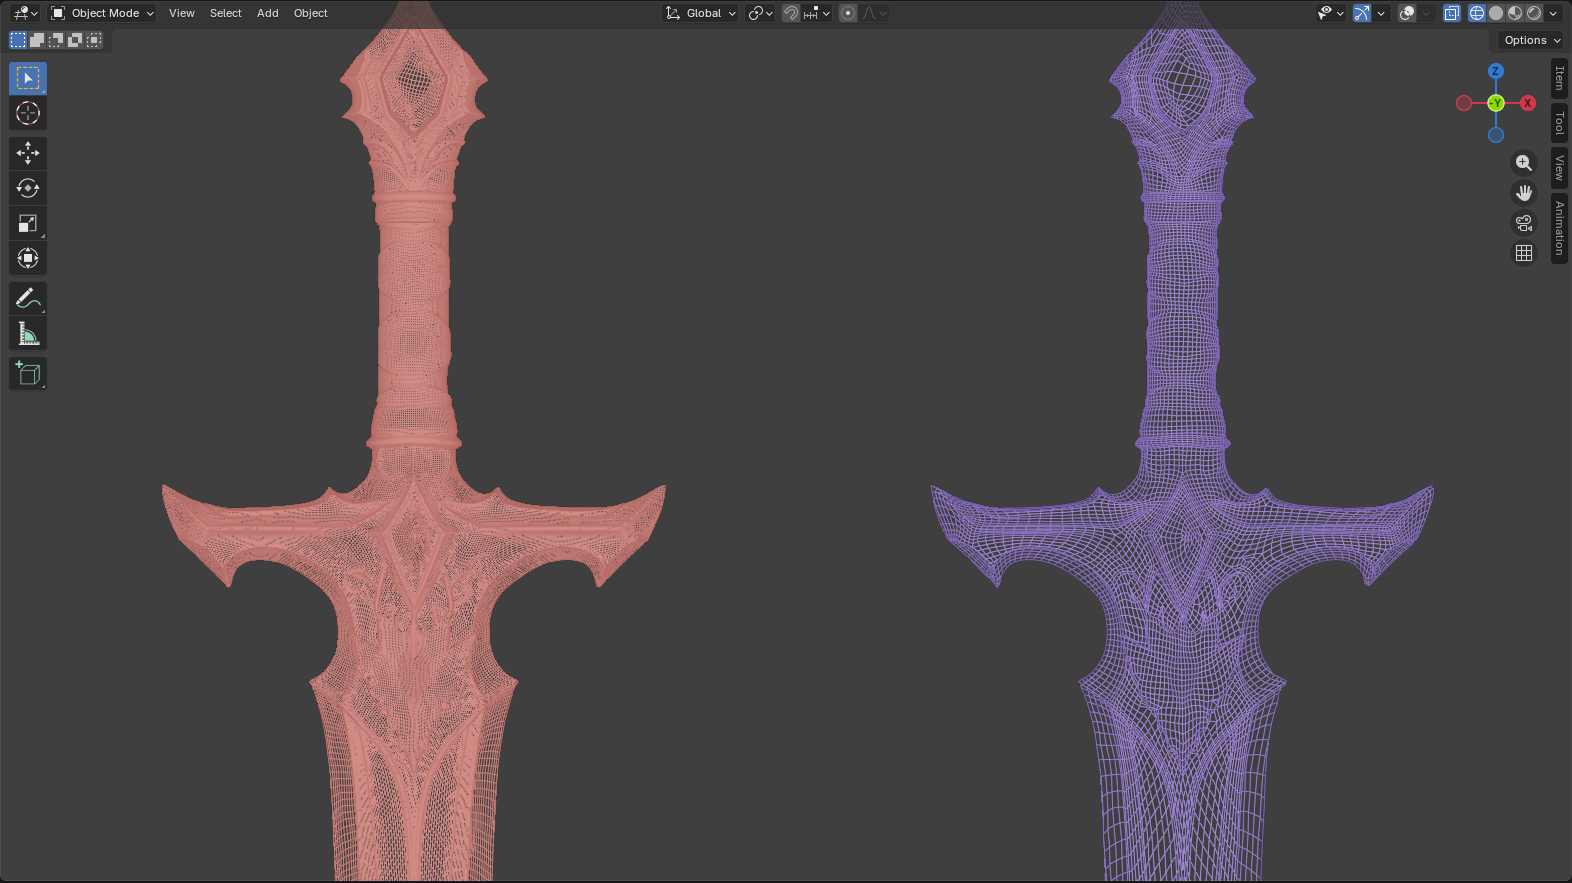
- Lower VRAM pressure: reduce polygon count, shrink textures, and adjust output resolution. Decimate or retopologize hero meshes you'll never see up close, downscale 8K textures that fill 1/8 of a frame to 2K or 4K, and render at the resolution you actually deliver; not 4K "just in case."
- Use OptiX over CUDA on RTX cards. OptiX uses the hardware RT cores and builds a more memory-efficient BVH, so it's usually both faster and lighter on VRAM.
- Instance, don't duplicate. Use linked duplicates / particle instancing / geometry nodes for repeated objects (foliage, crowds, screws) so they cost VRAM once, not a thousand times.
- Turn off what you can't see. Disable subsurf/displacement on background geometry, cap viewport subdivision, and exclude objects from ray visibility (camera/diffuse/glossy/shadow) when they don't contribute.
- Render image sequences, never a single MP4. If Blender crashes on frame 280 of a movie file, you lose everything. With a PNG/EXR sequence you just resume from 280.
- Use the right format. Multilayer EXR for compositing, but don't render 32-bit EXR when 16-bit half-float will do; it's smaller to write and move.
- Keep your GPU driver current (NVIDIA Studio drivers are the stable choice for content creation). A surprising share of "slow" and "crashing" reports trace back to an old or mismatched driver.
Blender render crash codes, decoded
A render that crashes isn't slow; it's stopped, which is worse. These are the error messages we see most often on real jobs, what they mean, and how to fix them. (If you searched one of these strings to land here: you're in the right place.)
| Error message | Root cause | Fastest fix |
|---|---|---|
CUDA error: Out of memory in cuMemAlloc |
Scene exceeds GPU VRAM | Shrink textures/geometry, switch to OptiX, disable Persistent Data |
No compatible GPUs found for path tracing |
GPU/driver not detected or unsupported | Update driver, re-enable GPU in Preferences |
A newer driver version is required to use OptiX |
Driver too old for OptiX | Update to a current NVIDIA Studio/Game Ready driver |
CUDA error: an illegal memory access was encountered |
Unstable GPU / overclock / driver | Remove overclock, update driver, test stability |
Display driver stopped responding and has recovered |
Windows TDR timeout on long GPU task | Render headless, or raise the TDR delay |
"CUDA error: Out of memory in cuMemAlloc"
Your scene needs more VRAM than your card has. This is the number-one render-stopper. Fixes, in order of effort: switch the device backend to OptiX (its BVH is more memory-efficient than CUDA), then reduce texture sizes and polygon count, then disable Persistent Data if you enabled it for animation (it holds data in memory between frames and is a frequent culprit in "crashes on the second frame" reports). Closing the viewport render and other GPU apps frees headroom too. If a single still simply won't fit, that's exactly the case for a farm node with more VRAM.
"No compatible GPUs found for path tracing. Cycles will render on the CPU"
Blender can't see a usable GPU, so it silently dropped to CPU; which is why everything suddenly got slow. Check Edit -> Preferences -> System -> Cycles Render Devices and confirm your card is listed and ticked under the correct backend (OptiX/CUDA for NVIDIA, HIP for AMD, oneAPI for Intel). The usual causes are an outdated or missing GPU driver, a GPU too old for the current backend, or, a classic gotcha, a second, weaker GPU in the system (or an integrated GPU) confusing detection. Update the driver, and if you mix cards, make sure the render GPU is the active/primary one.
"A newer driver version is required to use OptiX"
OptiX needs an RTX-class GPU and a sufficiently recent driver. Install the latest NVIDIA Studio driver, reboot, and re-check the OptiX tab in Preferences. If the card simply isn't RTX, use the CUDA backend instead.
"CUDA error: an illegal memory access was encountered"
This usually means the GPU became unstable mid-render rather than a Blender bug. Remove any factory or manual overclock/undervolt, update the driver, and check temperatures and PSU headroom on long renders. Reducing scene memory pressure (as above) also helps, since the error often appears near the VRAM limit.
"Display driver stopped responding and has recovered" (TDR)
On Windows, the OS resets a GPU that's been busy too long without responding; fine for games, bad for a 4-minute path-tracing pass. Render headless from the command line (blender -b file.blend -a) so the GPU isn't also driving your display, or raise the Windows TDR delay. Better still, hand long frames to a farm so your workstation GPU never hits the timeout in the first place.
The pattern behind every crash above: they cluster around VRAM limits, driver state, and single-machine timeouts. A render farm sidesteps all three; high-VRAM nodes, clean validated driver stacks, and headless rendering by default.
When the answer isn't a setting: render on a farm
You can optimize light paths perfectly, dial in adaptive sampling, and enable every trick above; and still be staring at 6 minutes per frame on a single GPU. Multiply that across 300 frames and you're looking at 30 hours of your workstation locked up. At some point the bottleneck isn't a checkbox. It's that you have one GPU.
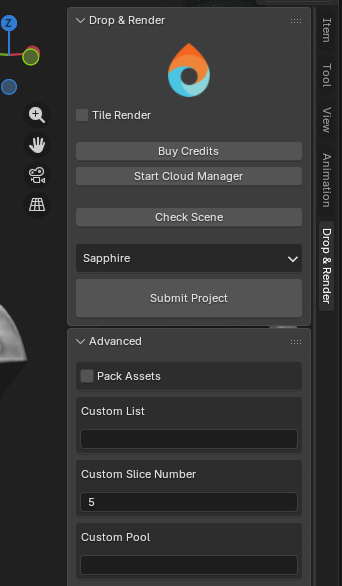
That's where Drop & Render comes in. Submit straight from Blender with our add-on, and your frames are spread across dozens of high-VRAM machines in parallel; the same optimized .blend, just finishing in a fraction of the wall-clock time:
- Zero asset remapping. Our add-on scans your scene and collects every texture, HDRI, Alembic cache, and VDB automatically. No packing, no path-fixing; just hit submit. (How the sync system works)
- Every Blender version, matched automatically; from legacy builds to the latest 5.x, so your farm render is a pixel-perfect match for your local one.
- Tile rendering for big stills. A single heavy 4K/8K frame gets split across multiple machines, so even one image finishes in record time. (Tile rendering)
- No VRAM walls. The crash codes above mostly vanish on nodes with far more memory than a desktop card.
- 300+ automatic project checks run before a single credit is spent, catching the issues that would otherwise fail a frame at 2am.
The math is simple: the most expensive render is the one that ties up your machine all night; or crashes at frame 280. Optimize your scene with the settings above, then send the heavy lifting to the farm.
Frequently asked questions
Why is my Blender render so slow all of a sudden?
The most common cause is that Cycles silently fell back to CPU rendering; usually after exceeding VRAM or a driver hiccup. Check Render Properties -> Device is set to GPU Compute and that your card is enabled in Preferences -> System -> Cycles Render Devices.
What is the single biggest way to speed up Cycles?
Sampling. Use Adaptive Sampling and control quality with the Noise Threshold (try 0.02) plus a sane Min Samples, rather than raising Max Samples. Combined with OptiX denoising, it's usually the largest single time saver.
Does reducing light bounces hurt quality?
Rarely. Cycles defaults to 12 total bounces, but most scenes look identical at 4–8 because the extra bounces carry almost no light energy. Drop them and clamp indirect light around 10 to remove fireflies.
Should I use OptiX or CUDA in Blender?
Use OptiX on RTX cards. It uses the GPU's RT cores and builds a more memory-efficient BVH, so it's typically faster and lighter on VRAM than CUDA.
How do I fix "CUDA error: Out of memory" in Blender?
Switch to OptiX, reduce texture and polygon sizes, disable Persistent Data if it's on, and close other GPU apps. If a single frame still won't fit in VRAM, render it on a higher-VRAM farm node.
Is a render farm worth it for a solo Blender artist?
Yes, when render time blocks your workstation or a deadline is tight. You pay only for the render time used, scale from one machine to many on demand, and skip the cost of buying high-end GPUs outright. New Drop & Render accounts start with €25 in free credits.
Render Blender projects with Drop & Render
Drop & Render is your trusted partner in bringing 3D creations to life. As a specialized render farm for Cinema 4D, Houdini, and Blender, we provide powerful, intuitive tools that help you render smarter, not harder.
Whether you're crafting stunning visuals as a solo artist or tackling massive projects with a studio team, our platform ensures you meet your deadlines while saving time and cutting costs.